")
 Much is said about a team’s ability to hold onto the ball nowadays. Playing a ‘ tiki taka’ possession game is all the rage in the modern-day game and such a style is commonly laid out as the foundational philosophy many clubs and their youth sides.
Keeping the ball makes a lot of sense and is a fairly simple concept. If the ball is in good possession, the chances of scoring are surely greater and thus the chance of conceding, smaller. However, few teams actually possess the ability to keep the ball for long periods of a game, particularly in the English Premier League. Arsenal had the highest average possession rate of last season with a very high 60.2%. Previous to that, it was Arsenal again in 2010/11 (59.9%) and Chelsea in 2009/10 (59.4%).
Currently, it is Manchester City who lead the possession ratings this season with 59.4%. Consider the fact that in Spain, Barcelona have an average possession of nearly 70% and it goes to show that keeping the ball in the Premier League is not an easy feat. It also doesn’t guarantee success.
Last season, Swansea had the third best possession rate with 58%, yet they finished in 11th place. Newcastle (47.3%) and Everton (48%) had significantly lower rates yet finished fifth & seventh respectively.
The idea behind this article was to look at the possession rates of teams in the Premier League this season, in all thirds of the pitch, and identify any correlations between this data and chances created and goals scored.
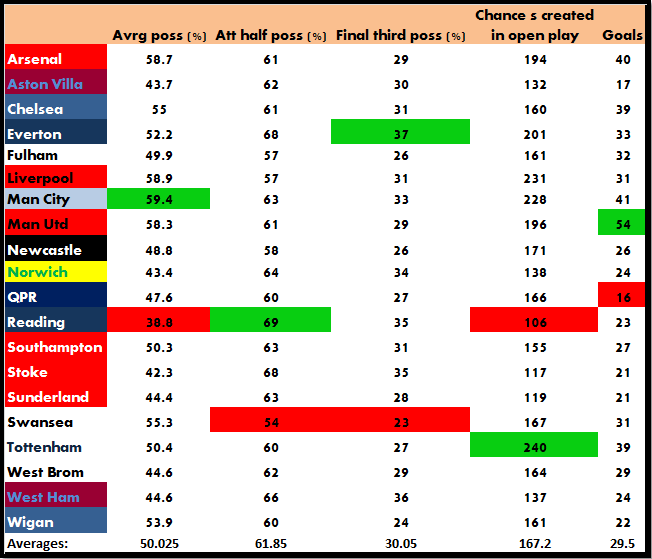
As mentioned, it is Manchester City who boast the highest average possession so far this campaign, although not right across the pitch. Surprisingly, it is Reading who have the highest average possession rating in the attacking half. Swansea, who again have relatively high average possession, falter in attacking areas and have the lower rating in both the attacking half and the final third.
Everton have been mightily impressive this season and show their dominance in high up areas with the league’s top possession rate in the final third with 37%. They are also the division’s fourth highest open-play chance creators, behind Liverpool, Manchester City and unexpected leaders Tottenham. It seems startling to see leaders Manchester United so far down that list, yet they have scored the most goals in the league this season. This undoubtedly highlights their effectiveness from set plays.
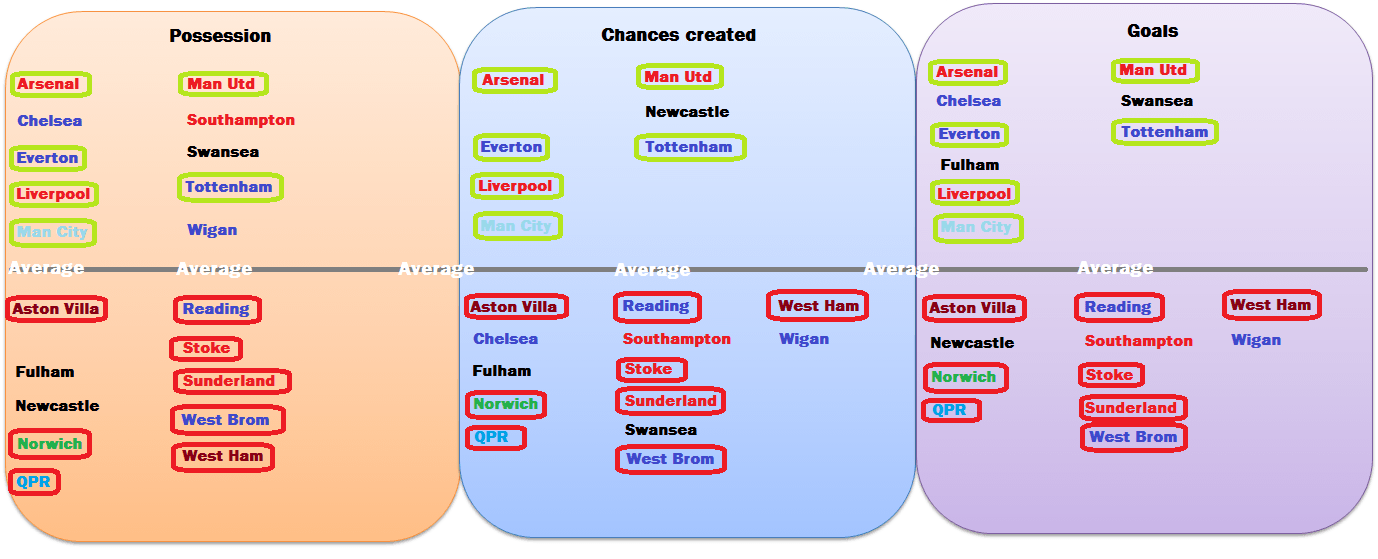
The above graphic highlights those teams that are performing above average in general possession, open play chances created, and goals scored (green). Teams highlighted in red,are those performing below average in all 3 categories. Where a team isn’t highlighted, this shows no correlation and a variation in the 3 criteria.
It comes as no surprise to see that 5 of the 6 teams in green currently occupy 5 of the top 6 spots in the division (Chelsea being the exception), while only West Brom and Stoke of the ‘red’ teams feature in the top half of the table.
Interestingly Chelsea, who enjoy a high possession rate and a high number of goals scored, are below average in chance production. This is the opposite of Newcastle United, who have low possession, high chance creation but poor output. Liverpool also buck the trend in their own way: high possession, high chance creation, and plenty of goals scored yet they sit eighth in the league table, emphasising their inability to see out games and get results.
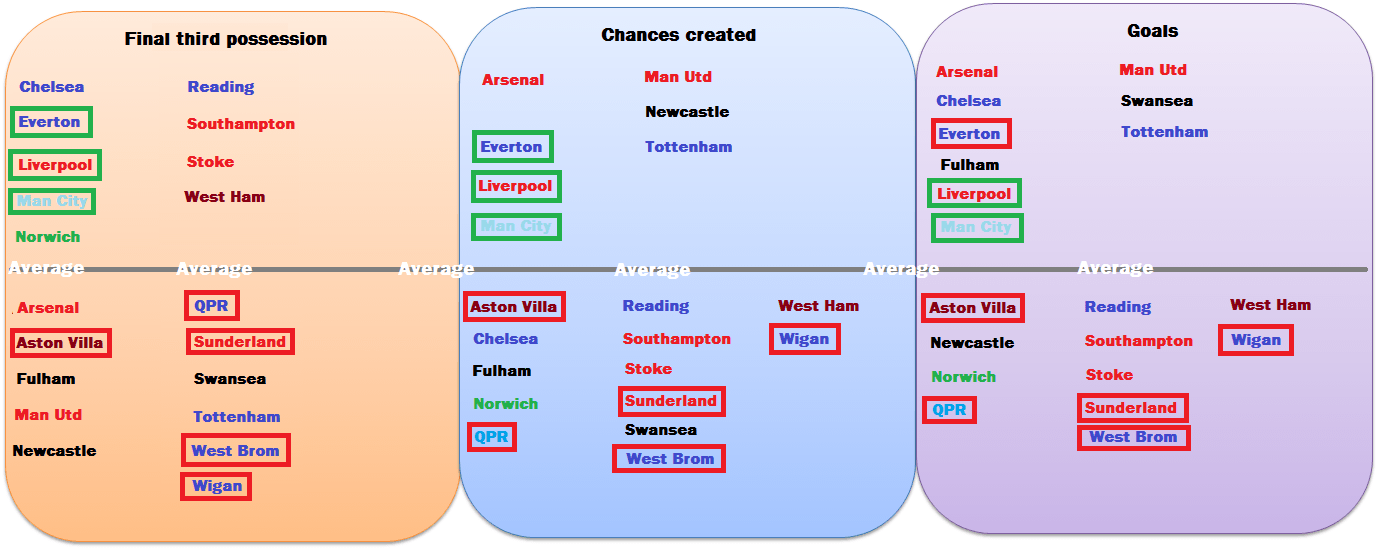
Correlation was again looked at in the above graphic, but with final third possession as the focus. Just three teams (Everton, Liverpool & Manchester City) score above the average for all three criteria, and just five teams feature in the ‘red’, compared to eight last time.
Manchester United again demonstrate low possession high up the field but high chance creation and goal output. So too Chelsea’s inability to turn their good final third possession into more chances is illustrated. Despite their high number of open play chances created, Tottenham don’t spend much time in the final third, highlighting their speed of attack and willingness to play on the break, the same of which can be said for Arsenal.
It is no revolutionary idea to discover that, generally, the teams who have the highest possession rates tend to do well in the division, but there are plenty of anomalies to this paradigm: teams that keep the ball well, and keep it in the right areas. Nevertheless the higher scorers in the division tend to spend very little time in the most dangerous areas.
For all the time Reading, West Ham, Stoke and Southampton spend in the opposition’s third, their chance creation and goal output is very poor. The better teams manoeuvre the ball into those areas with speed and don’t give opposition teams time to get their shape and ‘mark’ efficiently.
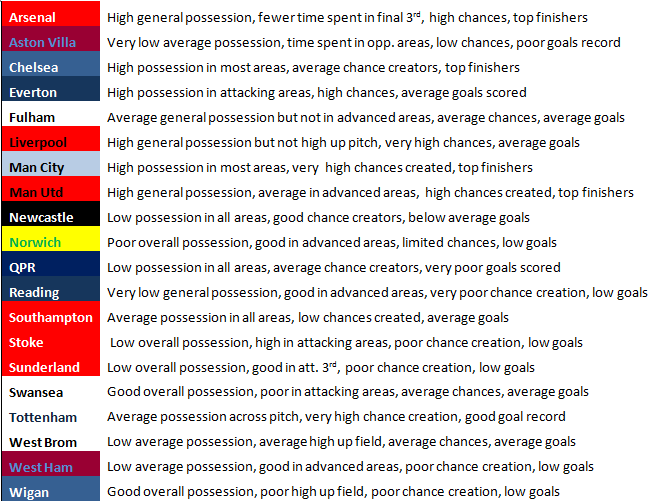
Brief team summary: